
Tl;dr: The following post details how we measure client performance across products and cross-functional teams at Coinbase.
By Leonardo Zizzamia, Senior Staff Software Engineer
A lot has changed since 2018 when the Coinbase web team consisted of only a few engineers. Back then, while working on making our product faster with a small group across a single platform, we could rely on pre-existing open source tools.

In 2022, Coinbase now has engineers working across multiple product offerings and four platforms: React Web, React Native, Server Side Rendering and Chrome Extension. Performance across all four platforms had never previously been standardized, so we needed to address several aspects: a lack of sufficient, complete data for some platforms, the loss of efficiency when performance opportunities could not be identified, and consistent prioritization across all teams.
Knowing this, we introduced the Performance Vitals: A high-level scoring system that is clear, trusted, and easy to understand. Summarizing the performance health of an application into a reliable and consistent score helps increase urgency and directs company attention and resources towards addressing each performance opportunity.
Extending Google Web Vitals
The Web developer community has the Core Web Vitals standard to help measure client performance, which we have adopted and use actively at Coinbase.
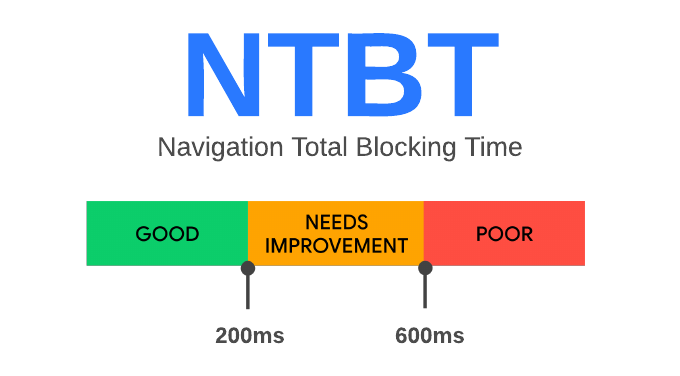
Vital metrics are differentiated by thresholds that categorize each performance measurement as either “good”, “needs improvement”, or “poor”.
Below is one example of where the threshold could lie for one of the Web Vitals, Time to First Byte.

To classify overall performance of a client product, Coinbase follows best practices and uses the 85th percentile value of all measurements for that page or screen. In other words, if at least 85% of measurements on a site meet the “good” threshold, the site is classified as having “good” performance for that metric. This metric is 10 points higher than the Google Web Vitals standard, giving us enough bandwidth to fix potential regressions.
The primary tool we use to capture these metrics is the Perfume.js library, a wrapper around the Performance Observer API that helps us measure all Core Web Vitals. However, as we are the primary maintainer of this library, we used this opportunity to research and develop new solutions around web performance measurements and ways of attribution.
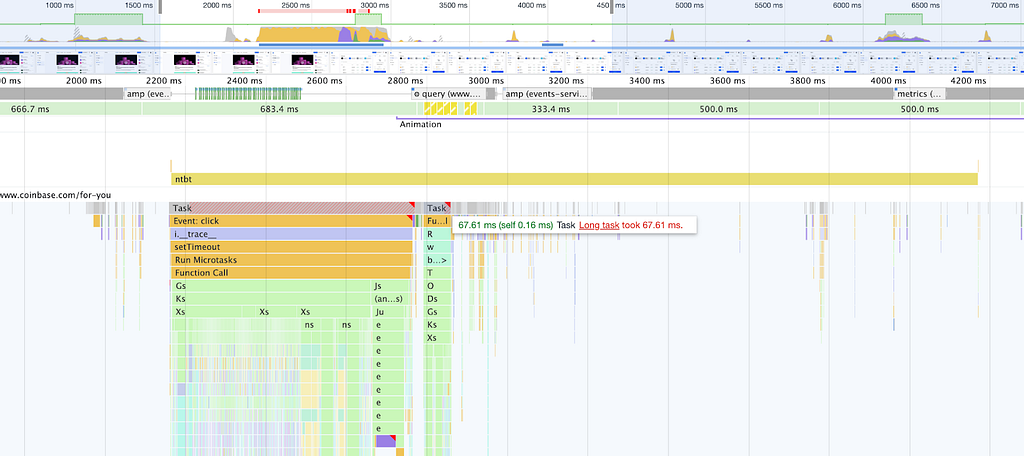
Today we introduce an innovative, in-house metric we call the Navigation Total Blocking Time (NTBT). The NTBT measures the amount of time the application may be blocked from processing code during the 2 second window after a user navigates from page A to page B. The NTBT metric is the summation of the blocking time for all long tasks within the 2s window after this method is invoked.
The image below is an example of an NTBT performance mark in coinbase.com helping a client engineer track down the long task and improve responsiveness when navigating between pages.
Another way it is helpful to use Perfume.js is that we are able to enrich all the metrics with the Navigator APIs info, to differentiate between low-end and high-end experiences.
After adopting and extending Web Vitals, the next step for us was to repurpose this knowledge throughout our stack.
Coinbase Performance Vitals
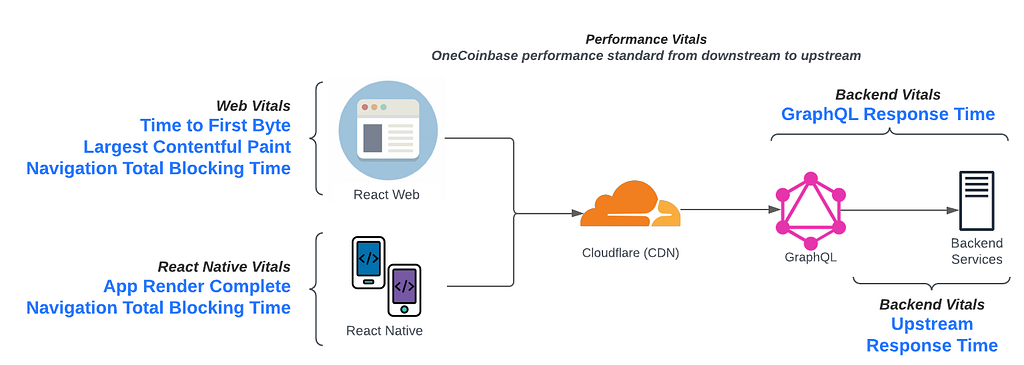
In addition to building web apps, we build React Native mobile apps and the services that provide their data. We re-used the Web Vitals best practices and created new metrics to serve React Native applications and our Backend services. Together, we call them “Performance Vitals”, and they give us a holistic view of the performance scores of all of our applications, from downstream (Browser & Apps) to upstream (Backend Services).
As seen in the chart below, the Performance Vitals are divided end-to-end, from downstream to upstream.
Creating React Native Vitals
When evaluating performance for React Native we developed the initial Vitals of App Render Complete and Navigation Total Blocking Time.
- App Render Complete (ARC): Measures the amount of time it takes to get from starting the application to fully rendering the content to the user without loading indicators. The Good threshold of 5s is based on guidance from the Android community official research.
- Navigation Total Blocking Time (NTBT): Measures the amount of time the application may be blocked from processing code during the 2s window after a user navigates from screen A to screen B.
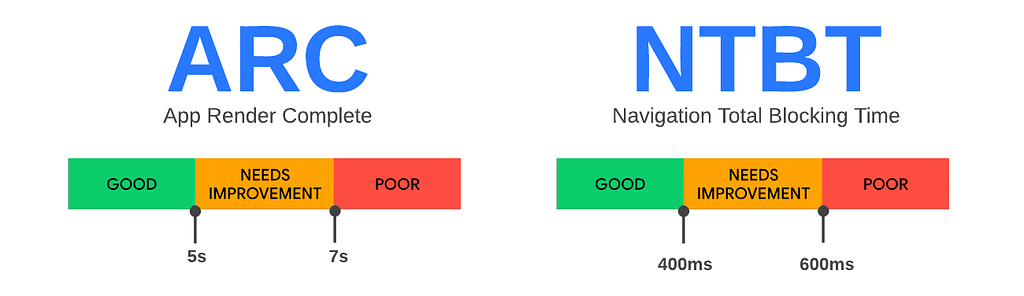
For NTBT we used the existing knowledge around Total Blocking Time from Web Vitals to determine a threshold for mobile. Given that a good TBT on Web is 200ms and we anticipate mobile to take longer, we doubled the standard from Web to arrive at 400ms for mobile.
The following video shows how a product engineer can detect long-tasks, measure total blocking time when navigating between pages, and additional NTBT measurements.

This metric helps catch potential sluggishness in a user interface, usually caused by executing long tasks on the main thread, blocking rendering, or expending too much processor power on background processes.
Similar to the experience of Web, Coinbase built an in-house React Native Core Vitals library to measure this performance, with the goal of open sourcing our discovery back to the community in the coming quarters.
Creating Backend Vitals
As we did with Web and React Native Vitals, we extended the Vitals standard to backend services including GraphQL and Backend Services.
The two metrics we first created are:
- GraphQL Response Time (GRT): Round trip time for the GraphQL service to serve a request.
- Upstream Response Time (URT): Round trip time for the API Gateway to serve a backend service.
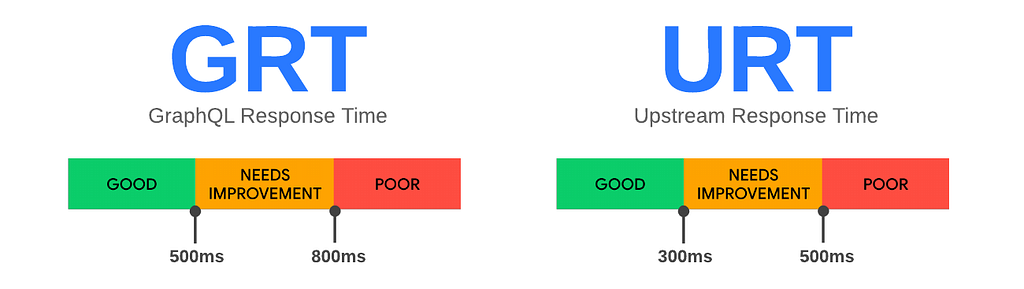
To determine a Good Score to represent backend latency, we considered several points:
- From a user’s perspective, the system response time feels immediate when it is less than 1s.
- We also have to take into account that the network cost could vary between 50ms-500ms, depending on which region a user is reaching our product from.
- Based on points 1 and 2, GraphQL latency should not exceed 500ms, meaning the upstream services must respond in under 300ms because GraphQL queries have to await the slowest endpoint.
- Therefore, we concluded that the threshold for a GRT Good score is 500ms, and URT Good score is 300ms.
For Backend Vitals we aim for at least 99 percent of measurements for each logged request to meet the “Good” threshold.
As we continue to improve our performance, we will revisit our Good scores annually, potentially even lowering them over time so we can further lower latency for our users.
The instrumentation for Backend Vitals is made up of three essential pieces. First, we use our in-house analytics library to define metadata like the product, platform, and pages. Then, we propagate this information into our APIs, and ultimately we co-locate the performance metrics with the Web or React Native metadata.
Performance Vitals discoverability and prioritization
Using the same metric scoring and attribution system across different specialties at Coinbase makes it easy to identify areas of opportunity and aligns both frontend and backend engineers in performance efforts.
All Performance Vitals are based on real-time data from our production applications and can be discovered by standardized filters, such as: product name, platform, page, is logged in, geo region, GraphQL operation, and backend service.
This level of accuracy becomes especially useful for Real Time Anomaly Detection. All teams are able to own the performance metrics for their product surface, giving them the ability to have automated monitors for performance changes and be alerted when regressions occur.
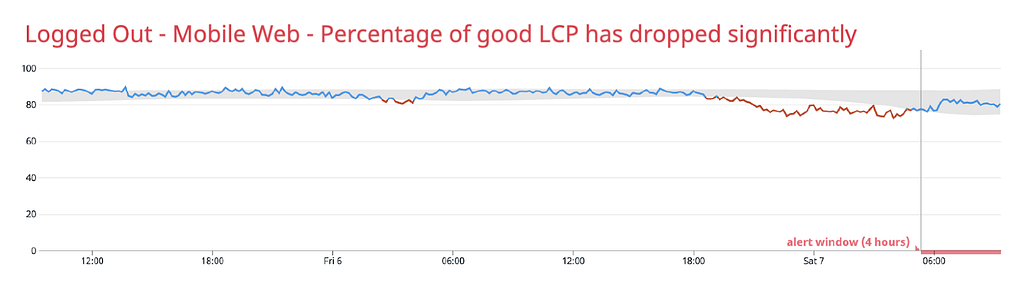
In case of a performance regression, we use the percentage of the regression to determine if it’s critical to open an incident and mitigate the issue as soon as possible, or create a bug that can be solved in the coming sprint.
Quarterly and annual planning
Performance Vitals are perfect for KR planning, as they measure a score from 0 to 100 and they can be easily stored for over a year. Common language for all performance KRs also makes it easier to create shared goals for teams across the organization.
A few examples of how you can frame your KRs are:
- [Year KR] Reach NTBT Good Score of 90%, up from 70% in the Coinbase Mobile App.
- [Quarter KR] Improve LCP Good Score from 70% to 85% in the Coinbase Web.
Up Next
Performance Vitals come back to finding a common language, whether it’s standardizing filters, setting quarterly KR’s, or unifying a scoring system. From a small team working on an API regression to large initiatives led by multiple organizations, speaking the same language helps all types of product prioritization.
In the future, we plan to open source some of our learnings and share more about measuring and driving impact for Critical User Journeys and how we use automation and internal processes to enable everyone at Coinbase to build performant products.
Performance Vitals: a unified scoring system to guide performance health and prioritization was originally published in The Coinbase Blog on Medium, where people are continuing the conversation by highlighting and responding to this story.
—————————————————————————————————————————————————————————————–
By: Coinbase
Title: Performance Vitals: a unified scoring system to guide performance health and prioritization
Sourced From: blog.coinbase.com/performance-vitals-a-unified-scoring-system-to-guide-performance-health-and-prioritization-127f80268ee4?source=rss—-c114225aeaf7—4
Published Date: Fri, 26 Aug 2022 14:01:35 GMT
Did you miss our previous article…
https://altcoinirareview.com/zethyr-exchange-tron-dex-for-the-users/